The Research Edge in 60 seconds
We turn complex stock and ETF data into clear visual buy/sell signals, keeping you ahead with a personalized feed of news, institutional moves, insider trades, earnings, and new opportunities, all curated around the stocks in your watchlist.
✓ No credit card ✓ 2-minute setup
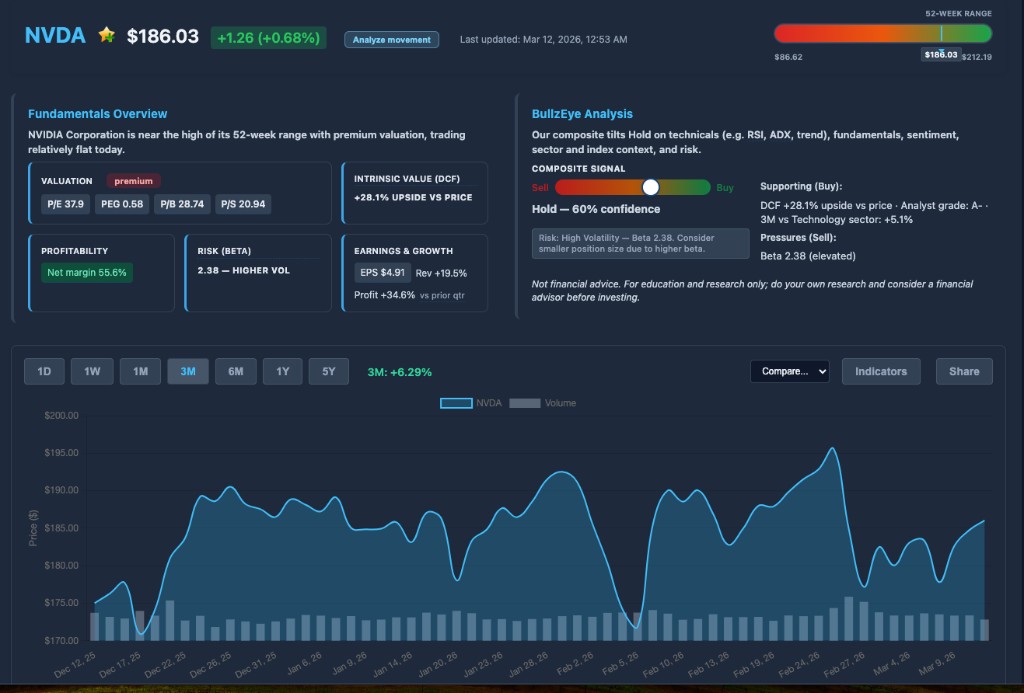
BullzEye Analysis
Our composite tilts Buy on technicals (e.g. RSI, ADX, trend), fundamentals, sentiment, sector and index context, and risk.
3M vs S&P 500: +4.9%. 3M vs sector: +4.7%.
Supporting (Buy):
ADX 33 — strong trend · Price above 20d EMA · Uptrend (trend slope) · DCF +73.1% upside vs price
Pressures (Sell):
RSI 66 — mild bearish · Z-score high — extended vs range · PEG > 1.5
Risk: Diversify and only invest what you can afford to lose.
Your Feed
This is a static glimpse. Open the live sample to see the same starter watchlist and personalized feed new members get—real quotes, news, and movers in one place.
Explore sample watchlist & feedYou don't need more data. You need clearer decisions.
- Too many tabs — news, ratings, charts, and fundamentals all scattered
- Too much noise — every source says something different
- Too little confidence — you're never sure what matters most right now
BullzEye View turns that noise into one decision-ready view.
How BullzEye View works
Three steps to faster, clearer decisions.
Add your watchlist
Pick the stocks or ETFs you care about.
Stay informed with a curated market feed
Daily briefs, movers, BullzEye Picks, and personalized watchlist news so you spot opportunities faster.
Act on what changed
Focus on what needs attention today, not yesterday's noise.
Explore the platform
Clear signals, transparent context. Every BullzEye signal is backed by visible market data. Click any supporting or pressure factor to see the raw data behind it. BullzEye View is a research tool — not investment advice.
Ready to make faster, clearer investing decisions?
Join free and get your first BullzEye snapshot in minutes.
Get Started Free – No Credit Card